Australia’s national climate risk assessment report, released last week, revealed a horrifying future if urgent action to address global heating was not taken.
The report looked at 10 “priority hazards” – such as bushfires, flooding and extreme heat – and the risks they presented across Australia’s way of life (you can read about the key takeaways from the report here).
Sign up: AU Breaking News email
Accompanying the report was a new tool from the Australian Climate Service which provides access to data about climate hazards and risks.
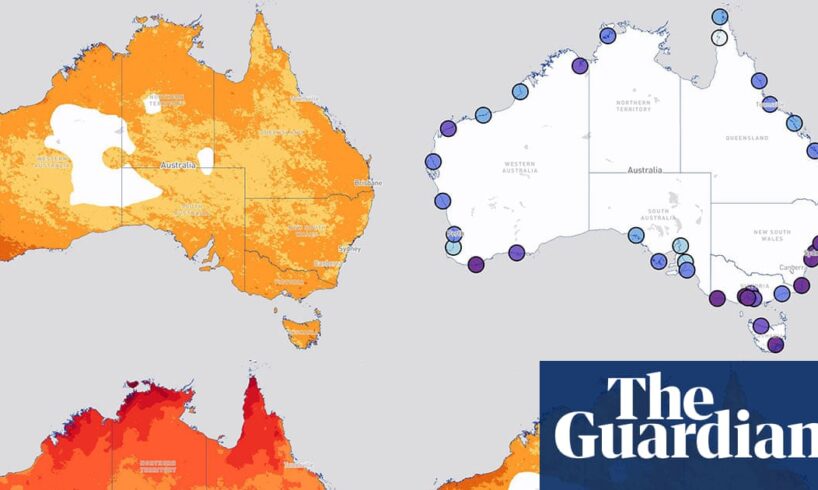
Here, I’ve brought together some of the maps released by the ACS which show just how bad things will get for heatwaves, drought and coastal flooding.
It is important to note that the worst outcomes shown on these graphics can still be avoided if urgent action is taken to reduce greenhouse gas emissions. The highest levels shown are based on a 3C increase in global temperatures which could happen as early as 2050 if emissions are not curbed.
According to the ACS the number of severe and extreme heatwave days is projected to increase, with the greatest increase in the northern parts of Australia.
As a consequence of the increase in temperatures and heatwaves, heat-related mortality is projected to increase dramatically under the worst global heating scenarios:
Showing the modelled increase in heat-related mortality* for selected Australian cities under different global warming levels: 1.5, 2 and 3 degree increases
Heatwaves are Australia’s deadliest natural hazard, with one recent study estimating they caused as many as 1,009 deaths in Australia from 2016 to 2019. The deaths attributed to heatwaves vary greatly depending on the methods used – the numbers are lower when only considering deaths that list heat as a contributing factor on official documents like coroner records and death certificates, but far higher when statistical methods are used to estimate excess mortality associated with heatwave events.
Time spent in drought is projected to increase, especially for areas in southern Victoria, South Australia, and Western Australia:
This will have obvious consequences for the agricultural industry, with reduced rainfall in growing seasons, in addition to crops facing higher heat stress from increased temperatures.
skip past newsletter promotion
Sign up to The Crunch
Free fortnightly newsletter
Our data journalists showcase the most important charts and dataviz from the Guardian and around the web, free every fortnight
Privacy Notice: Newsletters may contain information about charities, online ads, and content funded by outside parties. If you do not have an account, we will create a guest account for you on theguardian.com to send you this newsletter. You can complete full registration at any time. For more information about how we use your data see our Privacy Policy. We use Google reCaptcha to protect our website and the Google Privacy Policy and Terms of Service apply.
after newsletter promotion
In coastal areas, the ACS projects a significant increase in coastal flooding as sea levels rise. The following map shows the average number of days each year exceeding the record flood level, which is the highest water level recorded over the baseline period (1995–2014) at each location:
Minor flooding is also projected to increase significantly. For example, Sydney currently experiences minor flooding 31 days per year on average, but this could increase to 344 days a year with 3C of warming.
One headline figure from the climate risk report is that by 2050, more than 1.5 million people would be living in areas around the country that would be hit by rising sea levels and coastal flooding.
All of which underscores the importance of setting meaningful and ambitious targets for reducing emissions.
Maps shown are images taken from the ACS website, and so show cities as they are on the originals
Cities shown in the heat-related mortality chart were chosen by the ACS. The ACS declined to provide the same data for the missing capital cities