Ruto was accurate about inflation slowing down and the hiring of tens of thousands of teachers. He was also mostly correct about the growth of the education budget. But his claim that Kenya was on par “in nearly every measurable way” with Singapore, Malaysia and other Asian countries in 1963 when Kenya gained independence does not hold up. The president’s figures on maize production, sugarcane acreage, sugar production and imports, and tea earnings were also incorrect.
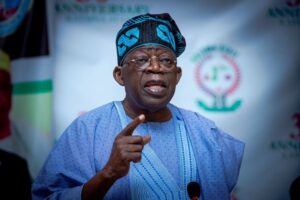
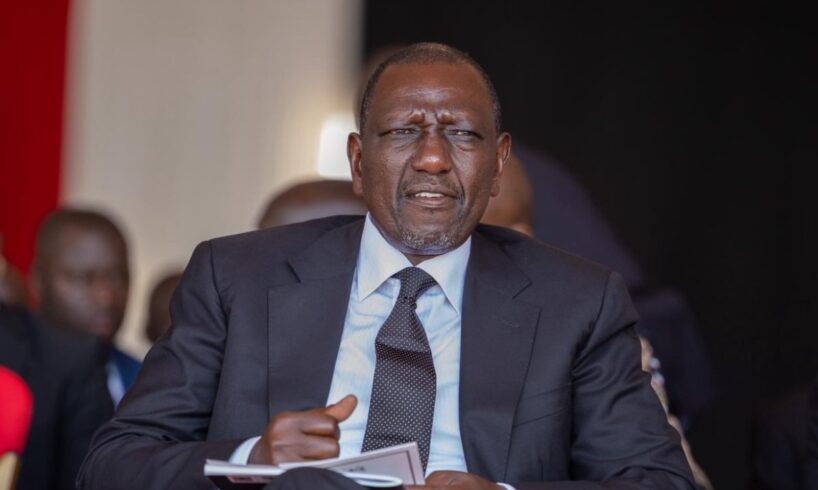
Kenyan president William Ruto, under growing pressure to deliver on his pre-election promises, appeared before parliament on 20 November 2025 to give his third national address since taking office in September 2022.
“Two years ago, when I delivered my first state of the nation address, I had a vision to sell. Today, I have a story to tell,” Ruto began, adding that this story was grounded in facts that were “available for all to examine, except perhaps for the cynical, who have no facts”.
In his speech, the president claimed progress, criticised his detractors and urged the country to back a new KSh5 trillion (about US$38.5 billion) development plan covering energy, transport and logistics, roads, education and digital networks.
Keep up with the latest headlines on WhatsApp | LinkedIn
“Today, the evidence is clear, evidence of promises made and promises kept,” Ruto declared.
Is this the case? Africa Check reviewed ten of his key claims.
The economy
In his address, Ruto told lawmakers that Malaysian prime minister Anwar Ibrahim was expected to visit Kenya on 22 and 23 November 2025.
Kenyan leaders have long pointed to Singapore, Malaysia and other “Asian Tigers” as models for the country’s development.
Former president Uhuru Kenyatta did so during a 2019 visit to Singapore. Ruto has also made similar references on several occasions, as did former prime minister Raila Odinga. Foreign observers have also echoed this comparison.
To assess this claim, we consulted the World Bank’s World Development Indicators for 1963, the year Kenya gained independence.
We reviewed the following key metrics: population, gross domestic product (GDP) and GDP per capita (adjusted for inflation and exchange rates), life expectancy at birth and the share of manufacturing in the economy.
Population
A country’s population influences the scale of its economy and labour force, which, in turn, affects its growth potential and demand for resources.
In 1963, Kenya and Malaysia had similar population sizes. South Korea’s population was more than three times Kenya’s, while Singapore and Hong Kong each had less than half of Kenya’s population.
Population of Kenya and four Asian economies in 1963 (million) Economy Kenya Malaysia Singapore South Korea Hong Kong Population 8.63 8.6 1.8 27.2 3.42
Source: World Development Indicators
Gross domestic product (GDP)
A country’s gross domestic product (GDP) measures the size of its economy. It is the market value of all goods and services it produces in a given period, usually a year.
Economists have previously told Africa Check that GDP comparisons are most accurate when using figures adjusted for inflation or “constant prices”.
The available data is expressed in 2015 US dollars, meaning all economies are valued using the 2015 dollar rate.
GDP at constant 2015 prices for Kenya and four Asian economies in 1963 (US$ billion) Economy Kenya Malaysia Singapore South Korea Hong Kong GDP 6.7 12.3 7.6 31.13 16.6
Source: World Development Indicators
This shows that in 1963, Kenya’s economy was just over half the size of Malaysia’s, slightly smaller than Singapore’s, about two-fifths the size of Hong Kong’s and only one-fifth the size of South Korea’s.
GDP per capita
GDP per capita, adjusted for inflation and exchange rates, reflects the average economic well-being of individuals and is a standard measure of living standards.
GDP per capita at constant 2015 prices for Kenya and four Asian economies in 1963 (US$) Economy Kenya Malaysia Singapore South Korea Hong Kong GDP 776.4 1,439.6 4,239.99 1,142 4,847.37
Source: World Development Indicators
The 1963 data shows that Kenya had the lowest GDP per capita of the five economies. Malaysia’s was nearly double Kenya’s, South Korea’s was about one-and-a-half times higher, and Singapore and Hong Kong were far ahead – more than five and six times Kenya’s level, respectively.
Life expectancy
Life expectancy at birth is the average number of years a newborn can expect to live if current mortality rates stay the same. It reflects overall health and human development, which strongly influence productivity and long-term growth.
Life expectancy at birth for Kenya and four Asian economies in 1963 Economy Kenya Malaysia Singapore South Korea Hong Kong Years 50.76 59.67 66.78 55.03 67.64
Source: World Development Indicators
In 1963, Kenya had the lowest life expectancy among the five economies. Malaysians lived almost nine years longer, South Koreans about four years longer, while Singapore and Hong Kong were far ahead, with life expectancy more than 15 years higher than in Kenya.
Manufacturing as a percentage of GDP
This metric indicates a country’s level of industrialisation, a key driver of economic transformation and export-led growth.
Manufacturing as a percentage of GDP in 1963 for Kenya and four Asian economies Economy Kenya Malaysia Singapore South Korea Hong Kong % 8.89 9.3 11.7 12.84 –
Source: World Development Indicators
In 1963, manufacturing made up just under 9% of Kenya’s economy, slightly below Malaysia’s and lower than Singapore and South Korea, where it accounted for about 12% of GDP. No data was available for Hong Kong due to post-colonial politics.
Ruto’s claim that these countries were Kenya’s peers “in every measurable way” is not supported by evidence.
Inflation measures how quickly the prices of everyday goods and services are rising. Kenya tracks this using the consumer price index, which monitors changes in the cost of household essentials.
When Ruto took office in September 2022, inflation was 9.2%. It rose to 9.6% the following month, driven mainly by high food and fuel costs. By October 2025, it had fallen to 4.6%.
A lower inflation rate doesn’t mean prices are falling, only that they’re rising more slowly. Even so, Ruto’s claim is accurate.
The Central Bank of Kenya tracks exchange rates and reports this in its monthly and weekly bulletins. After significant volatility from 2023 to May 2024, the shilling stabilised at KSh129 to the US dollar.
It has remained at this level from June 2024 to November 2025, a period of 17 months, seven months short of two years.
We rate this claim exaggerated. While his administration stemmed the shilling’s sharp spiral, which also happened in his tenure, the stability is less than one-and-a-half years, not quite “nearly two years”.
Agriculture
The national statistics bureau compiles crop production data from the agriculture ministry and publishes it in the annual economic survey. Maize output is measured in 90-kilogram bags.
However, Ruto’s figures are incorrect. The national maize harvest was not 44 million bags in 2022 nor was it 67 million bags in 2024.
Additional data from the Agriculture and Food Authority shows the same trend.
Africa Check previously examined a similar claim and found it inaccurate. The president’s figure of KSh138 billion for 2022 likely came from the Tea Board of Kenya, the industry regulator.
But customs data shows tea exports were KSh163.15 billion that year, a figure also reflected in the 2024 economic survey. Data on local tea sales for 2022 isn’t available.
In 2024, the tea board reported total earnings of KSh215.21 billion: KSh181.69 billion from exports, KSh18 billion from local sales and KSh15.52 billion from stock.
Customs and survey data total around KSh189 billion, which is consistent with the board’s figures.
Comparing available numbers, tea earnings rose by about 31.8% between 2022 and 2024, not 56%. While tea earnings did increase, Ruto understated the 2022 baseline, making the growth appear larger than it really was.
Sign up for free AllAfrica Newsletters
Get the latest in African news delivered straight to your inbox
Success!
Almost finished…
We need to confirm your email address.
To complete the process, please follow the instructions in the email we just sent you.
Error!
There was a problem processing your submission. Please try again later.
Ruto claimed that the area under sugarcane is “up by 200,000 acres”. According to the latest economic survey, the area under sugarcane increased by 50,800 hectares, or 125,549 acres, between 2022 and 2024.
Ruto’s claim of 200,000 acres is not supported by publicly available data.
According to data from the Kenya Sugar Board, the industry regulator, production was 796,000 tonnes in 2022, the year Ruto took office. This figure also appears in the 2024 national agriculture production report.
In 2024, production reached 815,500 tonnes. This is an increase of just 2.4% from 2022, not 76%.
Multiple data sources show Kenya imported 320,700 tonnes of sugar in 2022, the year Ruto took office.
When local production declined in 2023, imports rose to 608,200 tonnes.
Provisional figures for 2024 put imports at 339,300 tonnes.
This represents a 5.8% increase from 2022 to 2024, not a 70% decrease. The claim is incorrect.
Education
The Teachers Service Commission (TSC) employs all public school teachers in Kenya.
On 5 October 2023, during World Teachers’ Day, then TSC chief executive Nancy Macharia reported that Ruto’s administration had hired 56,000 teachers in its first year.
In December 2024, she confirmed that the TSC had employed 76,000 teachers so far – 56,000 on permanent terms and 20,000 interns.
The national treasury report of November 2025 also shows the government hired 65,000 teachers on a permanent and pensionable basis, and 6,000 intern teachers, for a total of 71,000 between 2022 and 2025.
The controller of budget tracks allocations to government ministries. Its latest annual report shows that the education budget was KSh489 billion in the 2020/21 financial year.
In the 2025 budget speech, the allocation to education was KSh702.7 billion.
Ruto’s claim is mostly correct.