
The English Indices of Deprivation 2025 (IoD25), published by the Ministry of Communities and Local Government, is more accurate than former studies because it includes the criteria of housing affordability. This is defined as “Difficulty of access to owner-occupation or the private rental market, expressed as the inability to afford to enter owner-occupation or the private rental market.”
The Thatcherite policies enacted by Conservative governments in the 1980s greatly exacerbated the UK’s historic north-south inequality divide. But they also set in train what is today a vast housing crisis in London that fuels poverty and defies this easy characterisation.
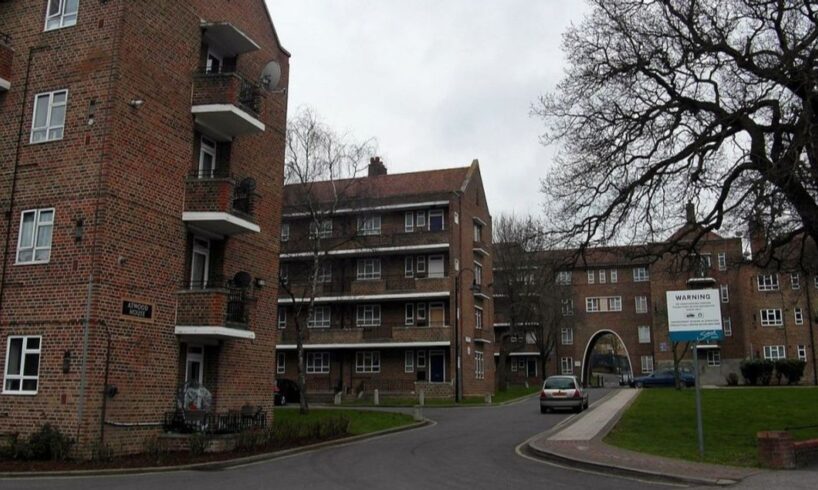
Public housing on Kingswood Estate built by the London County Council in the post-war period [Photo by Reading Tom from Reading, UK – Attwood House / CC BY 2.0]
Property prices in the capital have soared since the deregulation of the City of London financial markets, which began with the “Big Bang” in 1986. London’s house prices since then have risen at an astonishing rate of over 860 percent. The average price of a house in London in 1986 was approximately £55,000. Using Consumer Price Index inflation this would cost approximately £206,000 today. Latest figures from August this year show the average London property now costs over £550,000.
As London house prices rose steeply, much of the capital’s council housing was privatised. The impact of Thatcher’s “Right to Buy” policy—launched in 1980—has been to shift vast swathes of formerly public housing into the hands of rapacious private landlords. Today London has less than 400,000 units available for local authority rent, from a pre-Right to Buy stock that exceeded 700,000. Official figures for 2024 show that 1.3 million households were on social housing waiting lists in England, a figure predicted to reach over 2 million by the end of the decade. Of these 336,366 households were social housing waiting lists across London’s local authorities, the highest figure in over a decade.
The IoD25 housing affordability criteria also includes the cost of private rental. The destruction of public housing has been a financial boon to private landlords as cheaper former council properties come onto the market which they snap up and turn lead into gold by charging rents multiple times those charged for the equivalent property by the local authority.
Housing costs take up the lion’s share of working class Londoners’ household spending. How much as a proportion of their income workers’ pay for housing has a huge impact on their disposable income, and the wider impact of housing affordability is a significant driver of deprivation.
The identification of a large number of inner London neighbourhoods with deep deprivation, exacerbated by the punitive two-child welfare benefit cap—introduced by the Conservatives and retained by the Starmer Labour government—and a punitive housing benefit cap is largely the result of ever rising private rents. Office of National Statistics figures show how in the 12 months leading to December 2024 London was the English region with the highest percent rent rise (11.5 percent), only slightly less than the record breaking London rent rise (11.6 percent) in the 12 months leading up to November 2024. London’s annual inflation has slowed but still exceeds the RPI inflation index at over 5 percent and the average rent in London is the highest in England at an eye watering £2,260 per month, over £27,000 a year.
In Stamford Hill, Hackney, the proportion of children affected by income deprivation has jumped from 8.9 percent in 2019 to 99.9 percent in 2025, and this is not a one off.
The English Indices of Deprivation 2025 ranks areas in England from most to least deprived. The research studies 33,755 small Lower-layer Super Output Areas (LSOA). These are designed to be consistent, accounting for a similar population size across the country—on average 1,500 residents or 650 households—and all types of geographic area.
Seven domains of deprivation with varied weighting combine to create the Index of Multiple Deprivation (IMD25): Income (22.5 percent), Employment (22.5 percent), Education (13.5 percent), Health (13.5 percent), Crime (9.3 percent), Barriers to Housing and Services (9.3 percent) and Living Environment (9.3 percent).
Overall, 82 percent of neighbourhoods that are in the most deprived decile were also the most deprived according to the IMD19—the last of these surveys was conducted in 2019. Deprivation is spread right across the country, with 65 percent of local authorities containing at least one highly deprived neighbourhood, up from 61 percent in 2019. Almost 100 percent of children in 73 neighbourhoods in England are living in income-deprived families. In 2019, no neighbourhood had more than 90 percent of children living in income deprivation. In 2025, the figure stands at 280, and in 73 neighbourhoods 99 percent of children are deprived.
Deindustrialised Blackpool, Middlesbrough, Burnley, Manchester (all in the north of England) and Birmingham (in the Midlands) are the top five most deprived local authority areas. Neighbourhoods in Blackpool account for seven of the 10 most deprived neighbourhoods. Half the neighbourhoods in the north Yorkshire town of Middlesborough, with a population of over 150,000, are very deprived.
The Tendring neighbourhood in Jaywick in Reform UK leader Nigel Farage’s Clacton constituency in Essex is listed as the most deprived district in England for the fourth consecutive time since 2010.
Concentrations of deprivation, frequently deep, exist in all urban conurbations, cities and towns, north and south. These include Birmingham, Bradford, Nottingham, Blackburn and coastal cities and towns like Liverpool, Blackpool, Hartlepool and Hastings and parts of east London. What they have in common is extensive deindustrialisation.
According to the IoD25, many of the most deprived 10 percent (3,375) of neighbourhoods in England rate poorly across all seven domains of deprivation. Almost all of these areas (99.1 percent) are in the most deprived decile on at least two from the seven domains of deprivation. More than two-thirds (67.2 percent) are highly deprived on four or more domains.
Working class neighbourhoods, inner city and suburban, with public and private housing alike, that were devastated and deprived for decades since the onset of de-industrialisation in the early 1970s are still desperately deprived today.
Due to the inclusion of housing affordability criteria the IoD25, the research reveals something noteworthy—the pockets of deep urban deprivation previously camouflaged by conflation with other close by neighbourhoods with little deprivation. Especially within inner London, great deprivation and almost unimaginable wealth exist cheek-by-jowl.
London’s gentrification means an area like that close to the Nine Elms development in Lambeth—complete with a new underground train station and home to the new United States embassy—leapt in just six years from the bottom 20 percent of deprivation to the least deprived 10 percent. The average house price (mainly apartments) in the development area is now approximately £1,109,891.
Alongside this, using the new methodology, the IMD25 reveals that neighbourhoods in the capital represent some of the most deprived parts of the country. Four out of the five areas in the UK with the highest proportion of income-deprived households are in London. These are the boroughs of Tower Hamlets, Hackney, Newham, and Barking and Dagenham, with a combined population of almost 1.2 million people.
Hackney from the air [Photo by Thomas Nugent / CC BY-SA 2.0]
Just over 40 percent of Tower Hamlets and Hackney and 39 percent of residents in Newham are living in income-deprived households. Alongside Newham, two London boroughs—Islington and Southwark—also rank as the most deprived regarding income deprivation among older people.
The responsibility for the entrenched nationwide poverty and in a capital over 9 million people lies with successive Thatcher-worshipping Labour and Conservative governments. In London, Labour has long been the dominant party in local government and retains control of 21 of the 32 councils in the city. Running for re-election in 2019 London Labour Mayor Sadiq Khan made a few populist promises to increase public housing availability. But it was this servant of big business and the super-rich who declared to the Spectator during his first campaign in 2016, “I welcome the fact that we have got 140-plus billionaires in London. That is a good thing.”
Join the fight for socialism!
Fill out the form to be contacted by someone from the WSWS in your area about getting involved.