
Millions live below the poverty line across the country
Richard Ault Senior Data Journalist/ Investigative Reporter and Pete Gavan Senior Editor
06:00, 04 Jun 2026
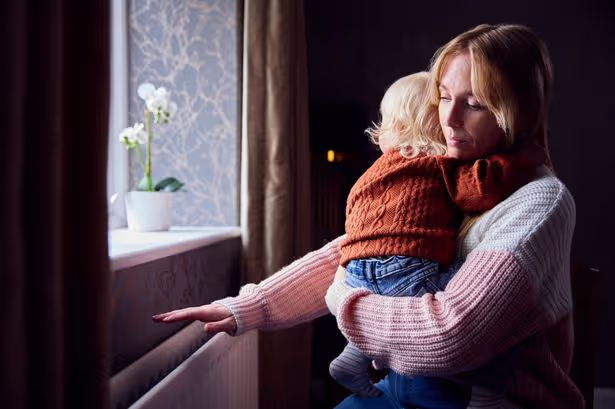
Millions of children are living in poverty(Image: Getty Images/iStockphoto)
The number of children living in poverty across the UK is on the rise, with two-thirds of kids in some neighbourhoods living below the breadline.
Almost 2.43 million children under the age of 16 were living in poverty in the UK during the year ending April 2025, and that’s even before housing costs were taken into consideration.
It works out as nearly one in every five kids in the country (19%).
Tackling child poverty was a manifesto pledge by Labour in the July 2024 general election, but the issue continued to grow in the party’s first 10 months in power.
Last year’s total was up from just under 2.36 million in 2023/24, a 3% increase of over 70,000 children.
Some parts of the country have far higher rates of child poverty than others.
The Arundel neighbourhood of Liverpool had the highest rates of poverty of any ward in the country last year, before housing costs.
A total of 757 of the area’s children lived in poverty last year.
That works out as over two-thirds (69%) of those under the age of 16 living in the area.
The Newport ward of Middlesbrough, meanwhile, had 1,778 children living in poverty last year. That works out as two-thirds (66%) of those living in the area.
The Heartlands neighbourhood of Birmingham also had two-thirds of children living in poverty, some 2,391 kids.
Three areas of Birmingham had the next highest rates of childhood poverty in the country – Alum Rock (64%), Bordesley Green (63%) and Small Heath (62%).
They’re followed by Daneshouse with Stoneyholme in Burnley at 62%, Bradford Moor in Bradford at 61%, Sparkbrook & Balsall Heath East in Birmingham at 60%, Manningham in Bradford at 60%, and Ward End in Birmingham at 60%.
You can check the rates in your local area using our interactive map:
Pendle had the highest rates of child poverty of any council area in the country.
Around two out of every five children living in the area (41% of them) were below the breadline last year.
That’s followed by Birmingham with 40% of children, Bradford with 39%, Oldham with 38%, Burnley with 37% and Hyndburn also with 37%.
At a parliamentary constituency level, Birmingham Ladywood had the highest rate of child poverty in the country. More than half (54%) of children living in the area were in poverty last year.
That’s followed by Bradford East (49%), Bradford West (48%), Birmingham Hodge Hill and Solihull North (47%), Birmingham Perry Barr (47%) and Birmingham Yardley (46%).
Sophie Livingstone MBE, chair of the End Child Poverty coalition, said: “One child growing up in poverty is one child too many and the figures show the huge scale of the problem as families face renewed cost of living fears.
“Securing a true assessment of the scale of child poverty in the UK is essential and it’s something we have called on ministers to carry out for many years. We are pleased that more accurate data is now available. This is going to help ministers and community leaders tackle child poverty in the regions of the UK that need it most.
“Scrapping the two-child limit to benefits was a good start but there is still work for the UK Government to do and continued investment to be made to give children the best start in life.”
Secretary of State for Work and Pensions, Pat McFadden said: “This government is determined to turn the tide on poverty after years of rising hardship. The statistics show that effort is beginning to make a difference – household incomes have risen 5% in real terms, food bank usage has fallen, and food insecurity is down.
“But we know there is more to do. That is why we are raising the National Living Wage by up to £900 a year for a full-time worker, cutting average energy bills by £150 from April, and delivering our Child Poverty Strategy which will lift 550,000 children out of poverty by the end of this parliament.”
Commenting on today’s HBAI findings, chief executive of Child Poverty Action Group Alison Garnham said: “Growing up in poverty damages children’s everyday lives and future chances. Removal of the two-child limit next month is an important first step in making life better for kids. With 4 million children living in poverty, government will have to invest in sustained support for children and families to meet its ambition to give every child the best start.”
The government has used a new methodology for this year’s childhood poverty report. That means that figures reported in 2025 are not comparable to those reported this year.
The number of children living in poverty has either increased or decreased, depending on whether you take housing costs into account or not.
With housing costs, the number of children living in poverty fell by 27,000 last year. Before housing costs, however, the number rose by 70,000 over the course of the year.
Top 20 wards, before housing costs
1. Arundel, Liverpool: 69%
2. Newport, Middlesbrough: 66%
2. Heartlands, Birmingham: 66%
4. Alum Rock, Birmingham: 64%
5. Bordesley Green, Birmingham: 63%
6. Small Heath, Birmingham: 62%
6. Daneshouse with Stoneyholme, Burnley: 62%
8. Bradford Moor, Bradford: 61%
9. Sparkbrook & Balsall Heath East, Birmingham: 60%
9. Manningham, Bradford: 60%
9. Ward End, Birmingham: 60%
12. Lozells, Birmingham: 59%
12. Gipton & Harehills, Leeds: 59%
12. Aston, Birmingham: 59%
12. Little Horton, Bradford: 59%
16. Toller, Bradford: 58.%
16. Whitefield & Walverden, Pendle: 58.%
18. Princes Park, Liverpool: 57%
18. Sparkhill, Birmingham: 57%
18. Park, Calderdale: 57%
18. Coldhurst, Oldham: 57%
18. Dewsbury West, Kirklees: 57%
18. Central, Hyndburn: 57%
Top 20 constituencies, before housing costs
1. Birmingham Ladywood: 54%
2. Bradford East: 49%
3. Bradford West: 48%
4. Birmingham Hodge Hill and Solihull North: 47%
4. Birmingham Perry Barr: 47%
6. Birmingham Yardley: 46%
7. Dewsbury and Batley: 44%
7. Birmingham Hall Green and Moseley: 44%
9. Oldham West, Chadderton and Royton: 43%
10. Manchester Rusholme: 42%
10. Walsall and Bloxwich: 42%
12. Sheffield Brightside and Hillsborough: 41%
13. Blackburn: 40%
13. Liverpool Riverside: 40%
15. Middlesbrough and Thornaby East: 39%
15. Burnley: 39%
15. Gorton and Denton: 39%
15. Bradford South: 39%
15. Leeds South: 39%
20. Bolton South and Walkden: 38%
20. Rochdale: 38%
20. Smethwick: 38%
Top 20 local authorities before housing costs
1. Pendle: 41%
2. Birmingham: 40%
3. Bradford: 39%
4. Oldham: 38%
5. Burnley: 37%
5. Hyndburn: 37%
7. Blackburn with Darwen: 36%
7. Sandwell: 36%
9. Manchester: 35%
9. Stoke-on-Trent: 35%
11. Middlesbrough: 34%
11. Leicester: 34%
11. Nottingham: 34%
14. Bolton: 33%
14. Kingston upon Hull, City of: 33%
14. Walsall: 33%
14. Wolverhampton: 33%
18. Rochdale: 32%
18. Luton: 32%
20. Blackpool: 31%
20. North East Lincolnshire: 31%
20. Doncaster: 31%